


In an age where we have to deal with huge amounts of complex data, it’s tough to get an overview of the data and represent them in a traditional way. This is where data visualization can help to break down complex data for better understanding.
Data visualization refers to the graphical representation of data and information, often using charts and graphs. They can be used to summarize research and analyze reports on business, studies, scientific research, sales & marketing, and so on.
For online platforms, presenting data with charts and graphs can be helpful to grab the audience’s attention. There are many ways to illustrate a graph on the website. However, the easiest way probably comes with WordPress.
In this article, you will learn how to create chart in WordPress using Elementor. We’ll walk you through the steps of creating different types of charts, how to configure the settings, input data, and get precise graphical output.
Importance of Data Visualization
Visualized data like charts and graphs are always an effective way to present information in a simplified manner. They provide an overview of complex data and make the information quickly understandable for the users. Moreover, visualized data can help to identify trends or patterns that may not be immediately evident from raw data.

Here is a brief discussion of why data visualization is significant for websites:
- Provides a better understanding of the data
It is always easy to understand and interpret visual data with charts and graphs. They make it easier to perceive complex information and patterns clearly and briefly. This is particularly effective for enormous datasets where it is difficult to take away the gist of that information.
- Summarizes information at a glance
Visualized data summarize large amounts of information at a glance. Charts and graphs give a simplified overview making it easier than analyzing the raw data to identify characteristics.
- Makes data accessible to a broader audience
By presenting data visually, you can make data more accessible to a broader audience. Charts and graphs are more comprehensible to non-natives than written data. This can be especially important for organizations that want to reach a broad audience with their data.
- Engages the audience
Data visualization with charts can make a website more engaging and interesting for users. This can increase the time users spend on the site and improve their overall experience.
- Improves decision-making
This can be particularly useful for decision-making. As it allows you to quickly assess the key takeaways from a set of data and make informed choices based on that information. Businesses can get benefited when data can drive important decisions
- Enhances storytelling
Illustrating data can help tell a story about the data being presented. A website can create a more compelling narrative by combining data with visual elements.
- Leaves a lasting memory
Visuals are always easier to remember than text for the human brain. This is because visuals are processed by a different part of the brain than text, making them more memorable.
Overall, data visualization is an important aspect of data-based websites and can help improve user engagement, understanding, and decision-making.
Things to Keep in Mind While Creating a Chart
- Determine the purpose of what message you want to convey and what data points will you highlight
- Once you know the purpose, choose the appropriate chart type. Select a chart type and format that best suits your audience’s needs.
- Use consistent formatting throughout the chart. Use appropriate colors and font sizes for similar data points.
- Make the labels and titles clear and concise with units and scales. They should reflect the message you want to convey.
- Keep it simple and don’t overload your chart with too much information.
- Consider your audiences and design a chart that matches their level of understanding.
How To Create Chart in WordPress
There are many ways and tools to create WordPress infographics, but which tool would you use to make a chart? If you’re looking to make powerful data visualization charts in WordPress, there are a few key things to keep in mind.
✅ Firstly, look for a plugin that supports a wide range of chart types, so that you can have varieties while creating charts.
✅ Secondly, focus on ease of use. Choose a WordPress chart plugin that has a user-friendly interface.
✅ Finally, make sure that it is compatible with your WordPress version, plugins, and themes that you use.
Considering the above checklist, the Elementor Chart widget from ElementsKit can be a perfect fit. It comes with all of those functionalities, making it easier to add a chart in WordPress than you might think.
Moreover, ElementsKit is an all-in-one plugin that comes with hundreds of features to design a complete website. So you don’t have to install an individual plugin only to create charts. Instead, you can get the Elementor chart creation tool along with all other page builder functionalities.

Types of charts available with ElementsKit:
- Bar charts (Horizontal and Vertical)
- Line chart
- Pie chart
- Doughnut chart
- Polar Area
- Radar chart
Configure chart settings in Elementor
You can start creating WordPress charts with the ElementsKit Chart widget by configuring the settings.
Firstly, you need to enable Chart widget from ElementsKit > Widget in your WordPress dashboard. Then, open the Elementor editor and drag chart widget into the design area.
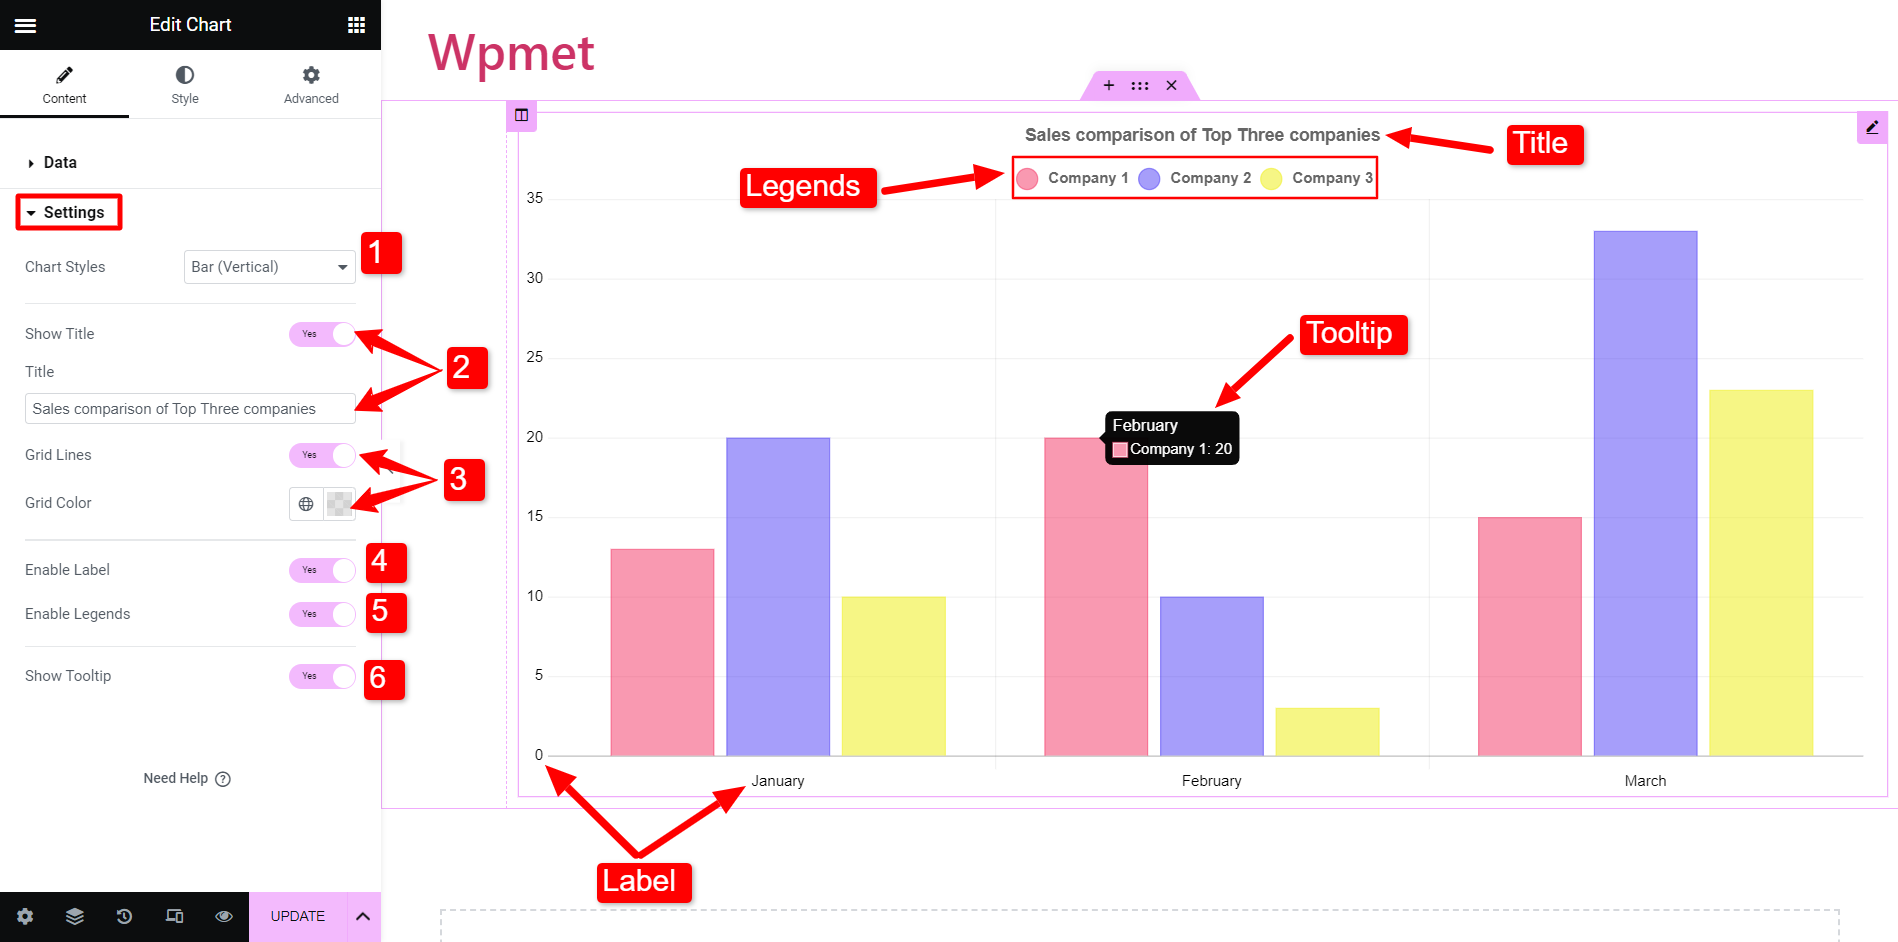
Now, to configure the chart widget, go to the Setting section under the content tab. After that,
- Chart Styles: Here, you can choose the chart type from the available categories.
- Show Title: Decide whether you want to show a title with the chart. If yes, then enter text in the title field.
- Grid Lines: You can show or hide the grid lines in the chart. If you decide to show grid lines, choose a color for it. (This option is not available with the Pie, Doughnut, and Polar Area charts)
- Enable Labels: By enabling this, you can show the labels.
- Enable Legends: Legends of a chart represent the data presented on the vertical axis (Y-axis). Enable this option to show the legends.
- Show Tooltip: You can also show tooltips for providing items’ context to create WordPress interactive charts.
The settings may differ based on the Chart styles you choose. As mentioned earlier, there are more than half a dozen types of charts available with ElementsKit.
Let’s now get a demonstration of how to create different types of charts in WordPress with Elementor.
How to make a Bar Chart in Elementor
Bar charts are often used to represent discrete data of categorical variables. These charts usually consist of categories on one axis and values on the other axis.
There are two types of bar charts are available with ElementsKit.
- Vertical Bar Chart: Categories are represented on the vertical (X) axis and values are on the horizontal (Y) axis.
- Horizontal Bar Charts: Categories are represented on the horizontal (Y) axis and values are on the vertical (X) axis.
However, configurations are the same for both of the bar charts. You can set the chart type to Bar from the settings section. Then open the Data section to enter the information and data of the charts.
For example, you want to show a sales comparison of the top three companies in a bar chart for the months of January, February, and March. So, here the months are considered as categories.
To add categories, go to the Data section. Under the categories, you can add the items and enter the label name.
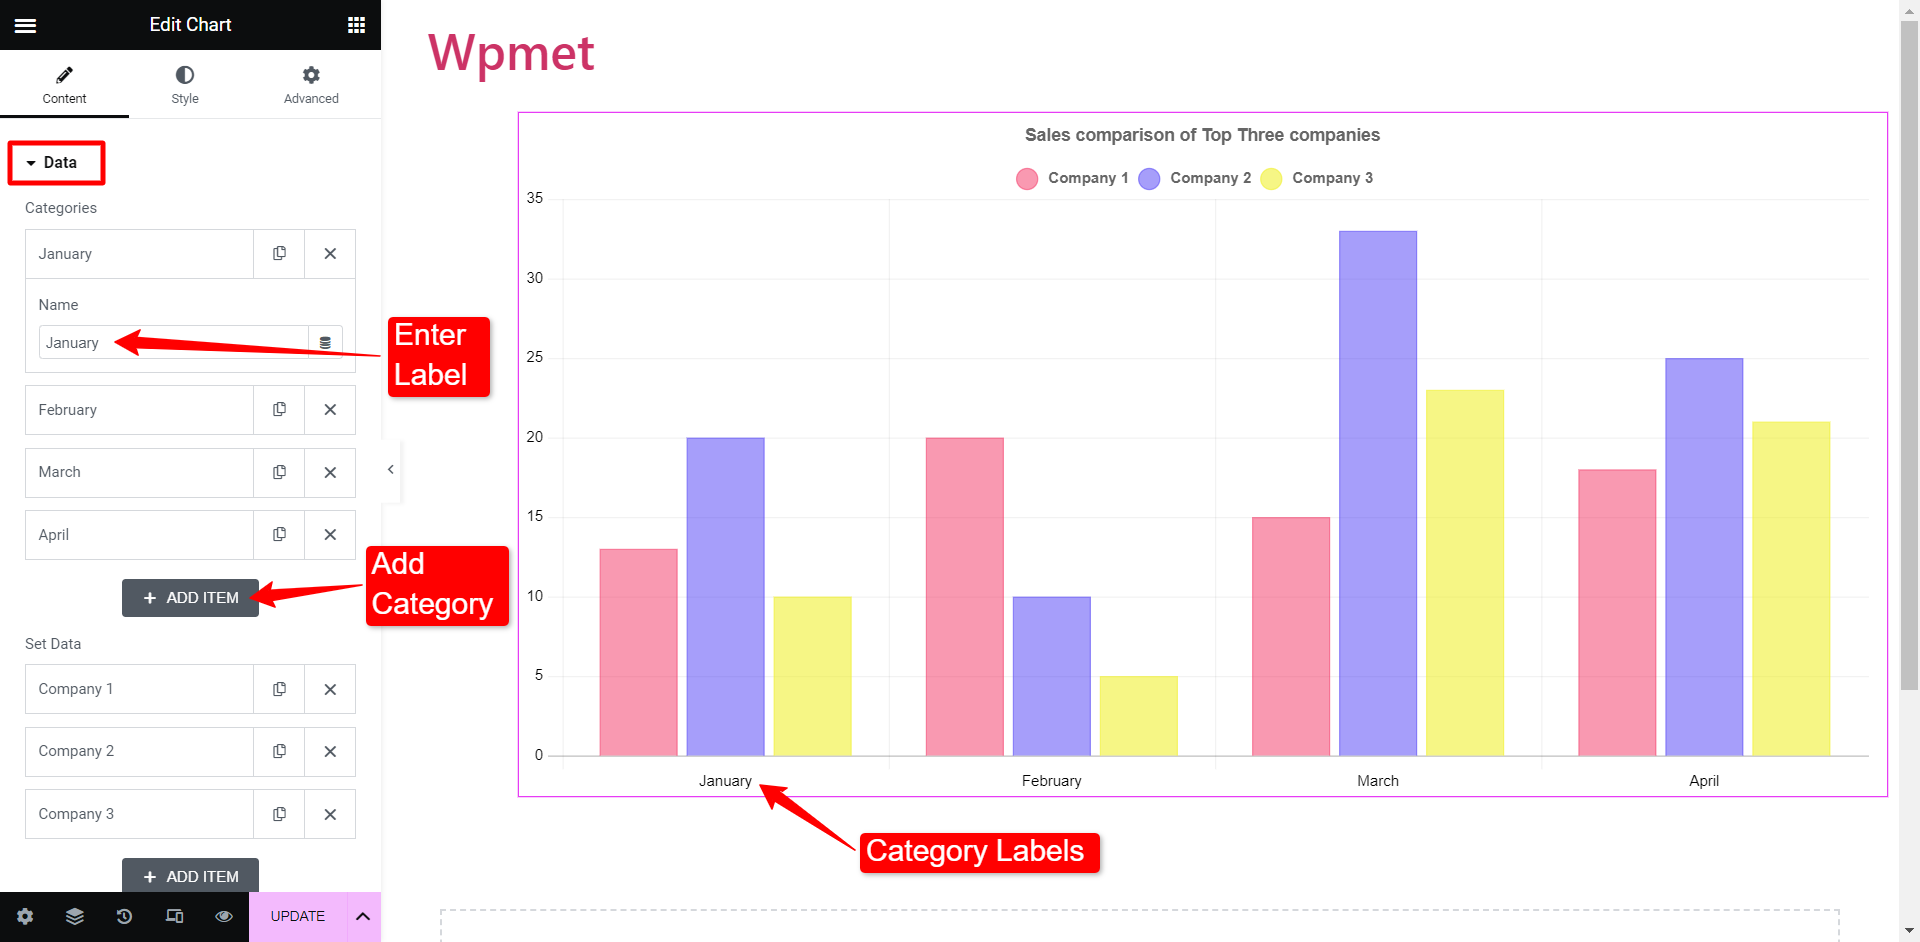
Next, you can Set Data by adding the company label (legends) and their respective data values. Suppose you have four categories, you can add data for each category with comma separators. The first value of the data field will represent data for category-1 and the rest will follow respectively.
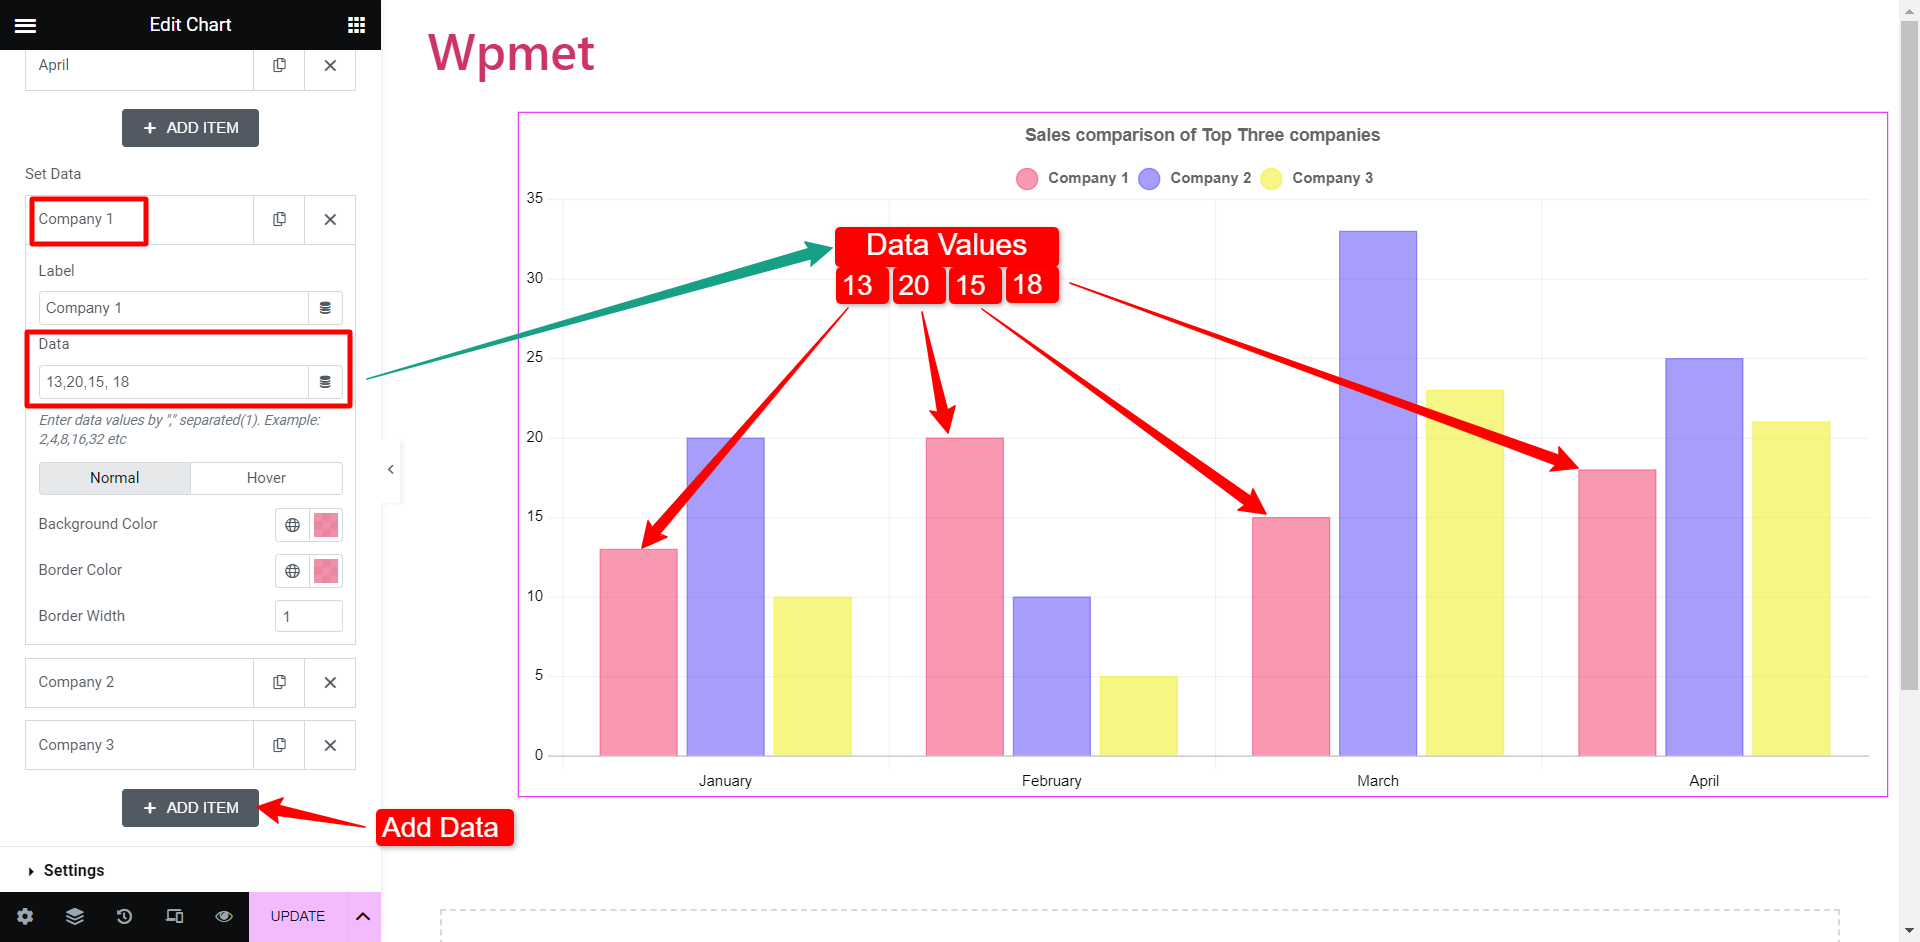
You can also change the background color and border colors of the specific bars.
The procedure for creating vertical and horizontal bar charts is the same. Based on which one you choose, the appearance will change. But you don’t have to change any settings or data to change the bar chart from vertical to horizontal or vice versa.
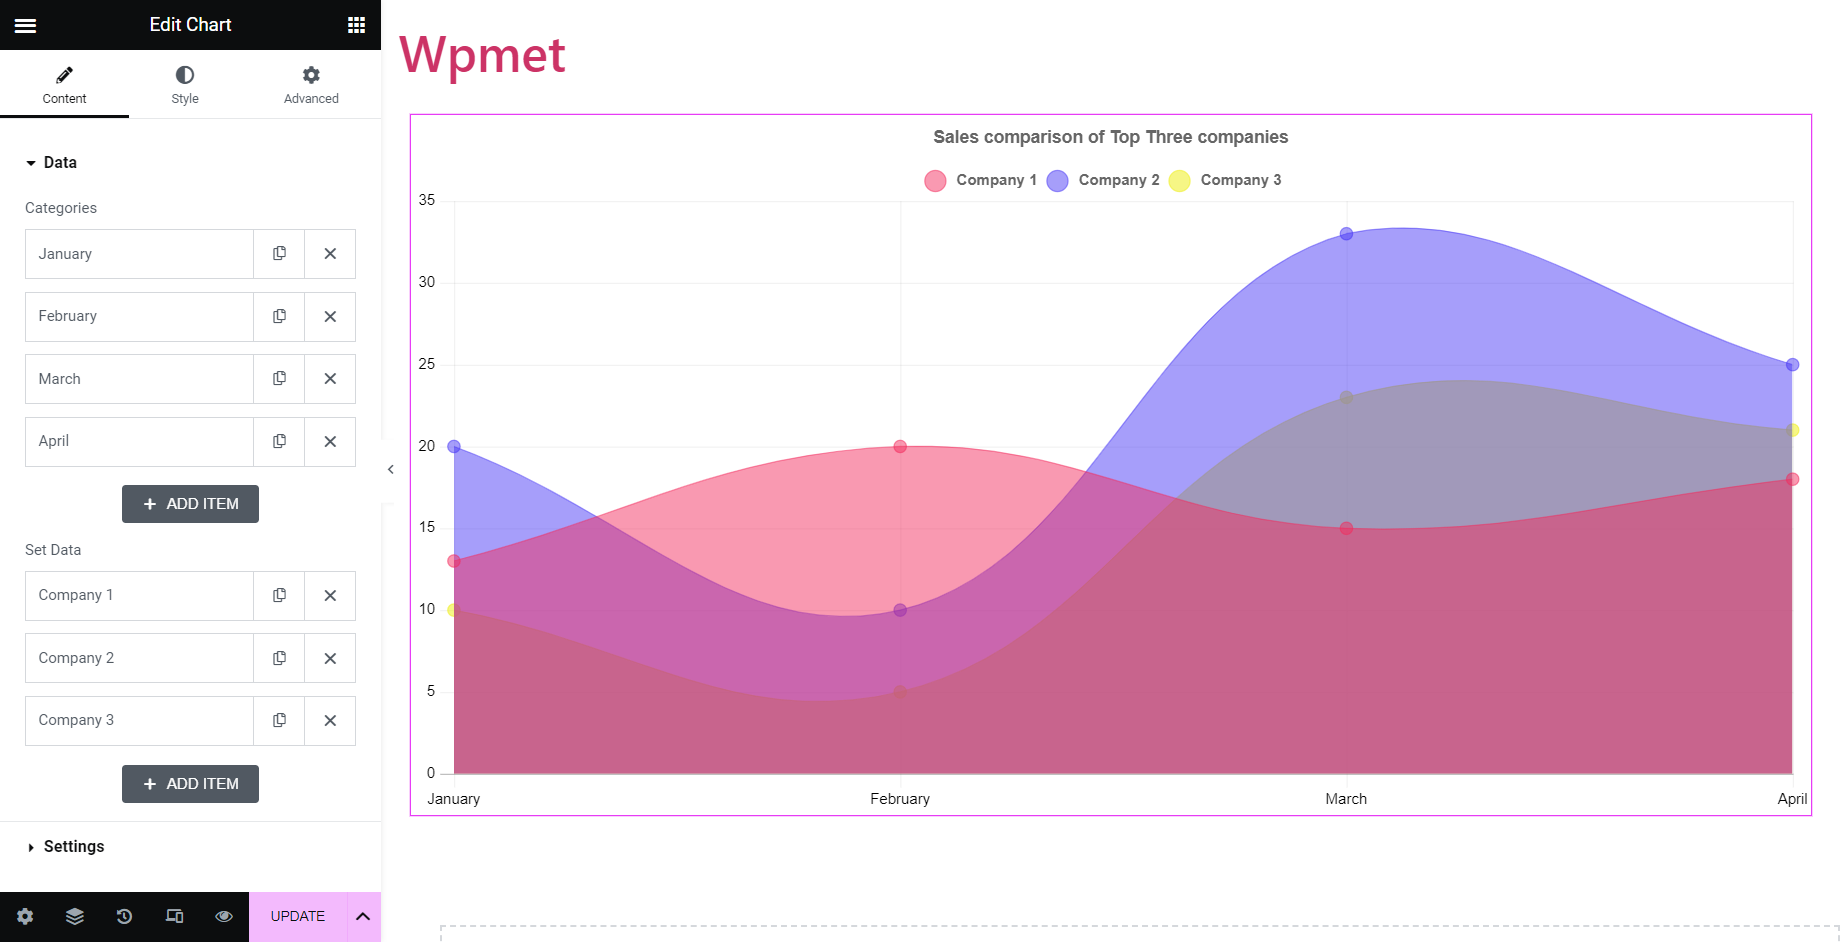
How to insert Line Chart in Elementor
Line charts represent information over a certain period of time that connects a set of data points with a continuous line.
The settings of the line chart are quite as same as bar charts. Change the Chart Style to Line. After that, you have to add the categories and the data set in a similar way you did previously. Then you’ll be able to represent data in a line chart.
How to Create Elementor Pie Charts
Pie charts represent data in a circular shape graph. Pie is divided into slices according to numerical proportion.
Pie chart, Doughnut chart, Polar Area; all fall in the class of pie charts. However, for the sake of variety, ElementsKit has classified these three pie charts into three different types. You have the classic pie chart, then the doughnut shape charts where the area of the center is cut out, and the Polar Area chart where each segment has a different radius.
To create an Elementor pie chart:
With ElementsKit, all you need to do is enter the data and change the labels to create a pie chart in WordPress. Let’s take a yearly sales report of a company for example. The pie chart will show the percentage of sales generated from each source.
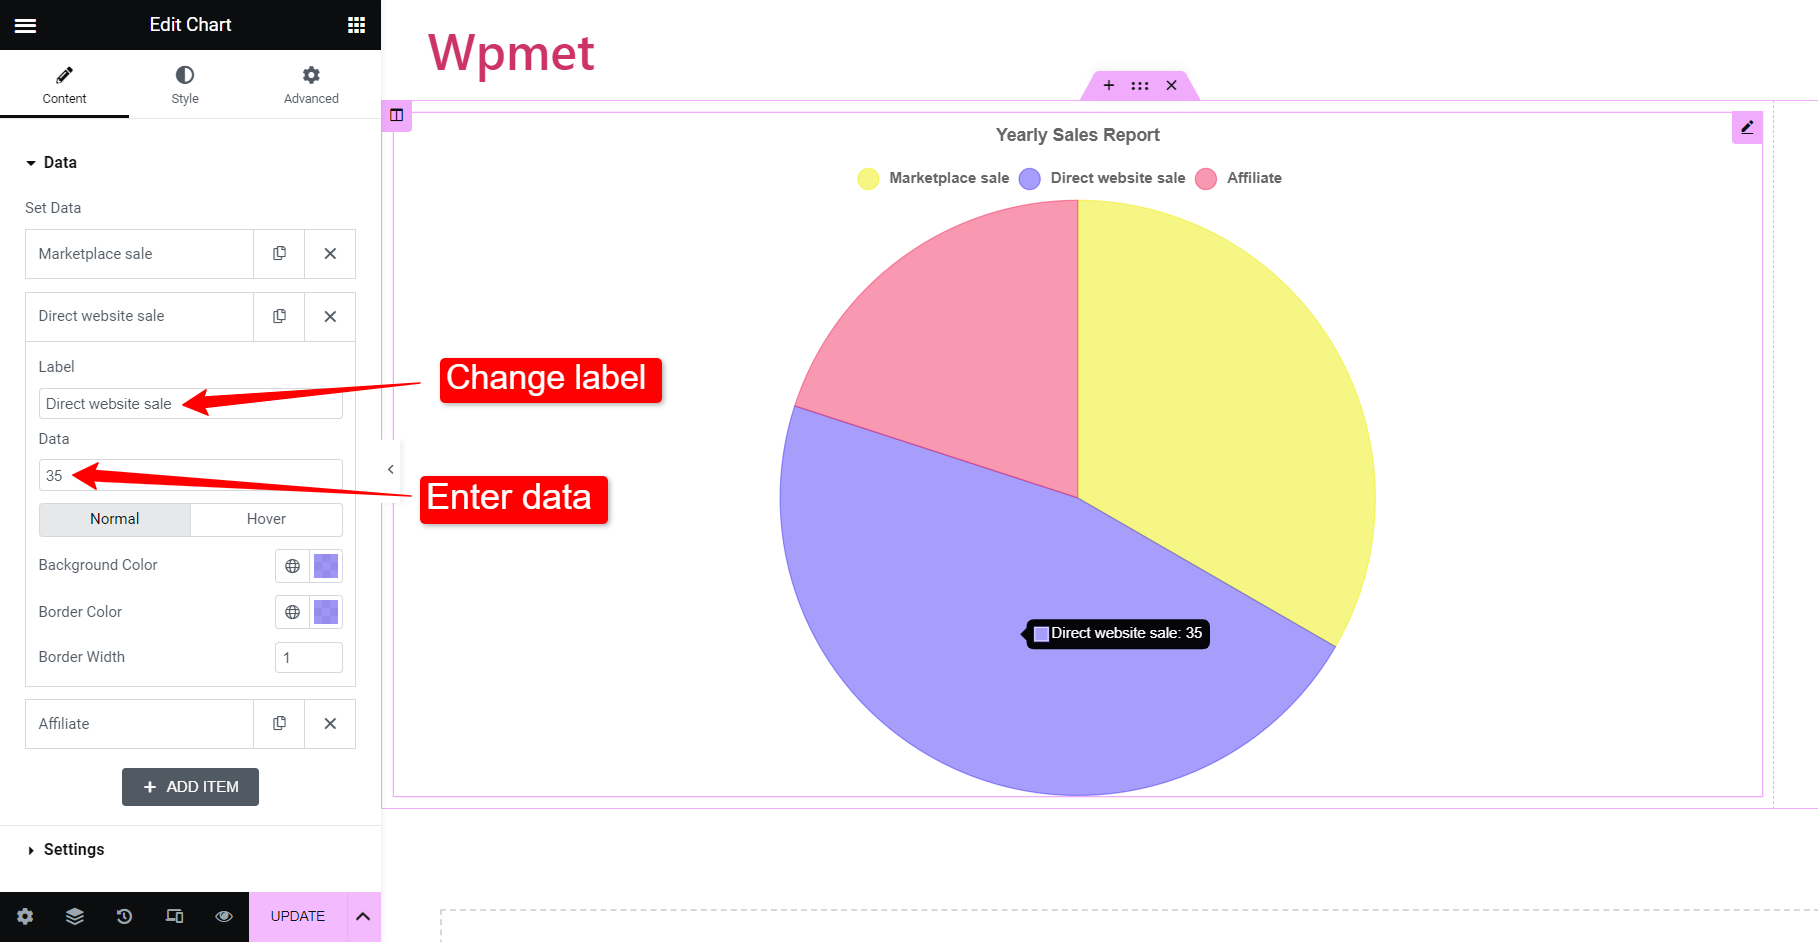
To illustrate the data, add the name of the source under the label field. Then enter the percentage of sales generated by that particular source. Options to assign a color for that source are available as well. Furthermore, you can add more categories by adding items.
Once you finish adding the data, you will get the pie chart created according to the given stats.
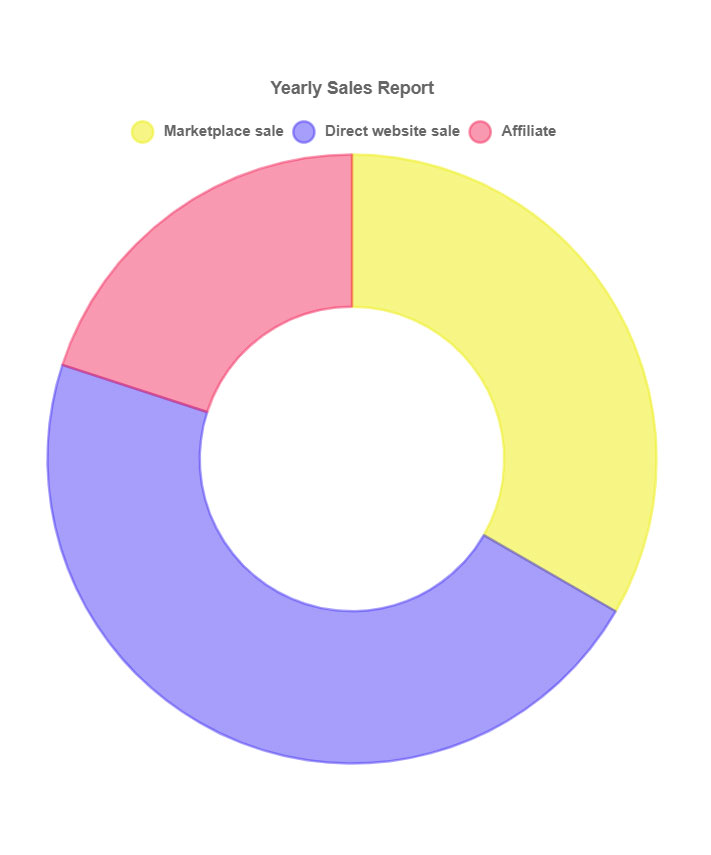
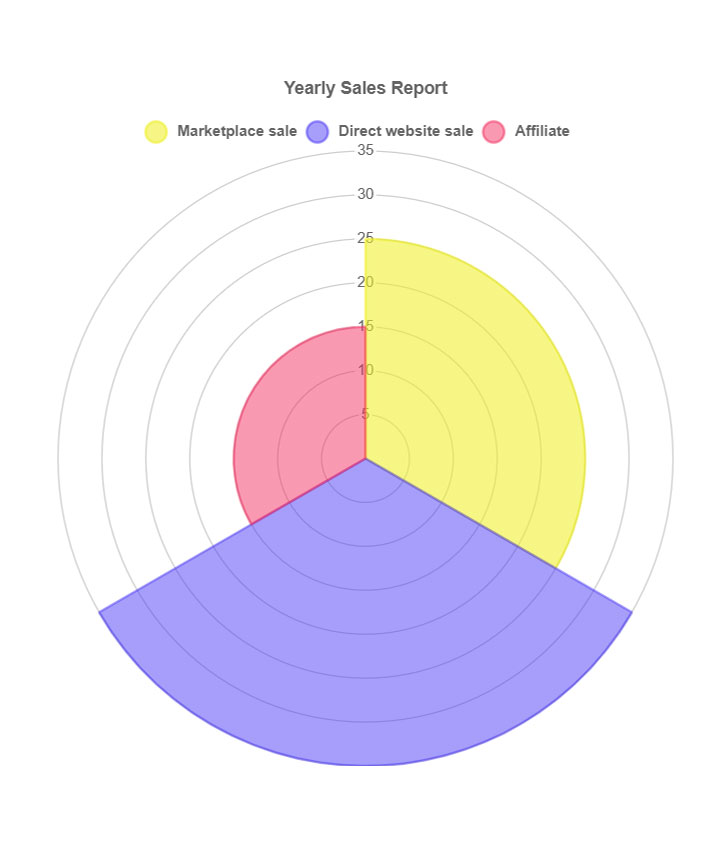
The procedure is the same for the “doughnut” chart and “polar area” chart. Just change the Chart Style to Doughnut or Polar Area and you will have the respective charts created based on your inputs.
These are the types of charts available with ElementsKit Chart widget. You can use the designs of readymade blocks as well.
Why Choose ElementsKit for Creating Charts in WordPress?
Out of all of the WordPress chart plugins, why we have used ElementsKit? That is because it meets all the requirements to be the perfect tool to create charts in WordPress.
👉 First of all, ElementsKit comes with 7 different types of charts that cover almost all kinda charts often a user may need.
👉 Secondly, it is the easiest way. All you need to do is enter the data and categories, and you’ll have a beautiful chart created. No need for manual designs or adjustments. However, you still have full flexibility to change the styles and appearance of the charts.
Besides, ElementsKit is one of the most popular WordPress plugins with over 1 million active users, giving you the assurance of compatibility and reliability at every point.
Overall, the all-in-one plugin features all most all functionality to create a website with plenty of features. Ultimately eliminating the necessity to install a plugin just to do a single task.
Leave a Reply