

If you are a web developer, you often deal with website bugs, right? Whether you code for a website from scratch or deploy already coded software programs, you are bound to encounter bugs. This is because coding errors are likely to happen in all types of computer programs including WordPress.
But every problem has a solution and so do bugs. In fact, as a web developer, one of your primary responsibilities is debugging bugs or coding errors. I named WordPress in particular as this write-up will deal with debugging WordPress coding errors holistically.
So, if you are a WordPress developer, this blog will be super handy for you. We will be providing you with some killer as well as effective debugging WordPress tips and tricks throughout this entire blog.
But prior to that, let’s define the term debugging and give you an overview of it. This will help you to understand the subsequent points better.
Debugging Explained:
Simply put, debug or debugging denotes detecting and fixing coding errors in a piece of software or a computer program. Generally, web developers are the professionals who carry out the debugging tasks.
Developers make use of a number of debugging tools to fix bugs in code. Once corrected, they run further tests to make sure that bugs don’t crop up again in the program. It’s key to note that debugging is a continual action in a software development process.
To debug a piece of software, you can adopt several tactics including unit test, code review, and pair programming. Before a software program is released, it’s the job of the web developers to ensure that the software program is free from bugs.
However, bugs can show up in a software post-official launch even after fixing the apparent ones. This is because it’s nearly impossible to identify all the bugs in a product in one shot. Some bugs in the program become visible after users start using the product. When complaints come from users about bugs, developers have to immediately fix them.
Why Debugging WordPress Site Matters Upfront:
Like WordPress security, debugging in WordPress matters a lot. When you design a WordPress site, you take advantage of many 3rd party plugins to enhance your site features. But all these plugins are unlikely to get you the fruits that you anticipate. Many of these plugins will trigger code conflicts with one another, crippling your WordPress site.
So how to debug a WordPress site to deal with the issue? Well, WordPress has a debugging mode that enables you to detect this type of code conflict upfront. This allows you to fix these issues before your site goes live. As a result, the time and endeavor required to fix emerging website bugs after the site goes live diminishes.
7 Effective Debugging WordPress Tips and Tricks:
Now, it’s time to cut to the chase, that is, provide you the likely solutions to debugging WordPress site. Normally, whenever any of us face our WordPress site crashing, we tend to deactivate or uninstall all our active themes and plugins. In fact, this is what we are asked to do. Not that it’s a wrong method to adopt.
But it’s time-killing and an inefficient method to get your site back on track. In this way, the real issues of your site may also go unnoticed. Hence, you have to come up with a real game-changer and that’s exactly what we are going to discuss here-
In case you are willing to know about recovering a hacked WordPress website, you can refer to the link below-
Avail of WordPress Debugging Plugins:
Plugins are always useful when it comes to the feature enhancement of a WordPress site. For example, if you want to enrich your site with social media features, you can make use of the social media plugins.
Likewise, if you want to have enhanced debugging features for your WordPress site, you can make use of top-notch WordPress debugging plugins. We would name and recommend 2 debugging WordPress plugins- Query Monitor and Debug Bar.
Query Monitor:
Query Monitor comes with some mind-blowing WordPress debugging features. It has a Developer tools panel for WordPress. It lets you troubleshoot or debug database queries, PHP errors, block editor blocks, hooks and actions, languages and translations, rewrite rules, enqueued scripts and stylesheets, HTTP API calls, and more.
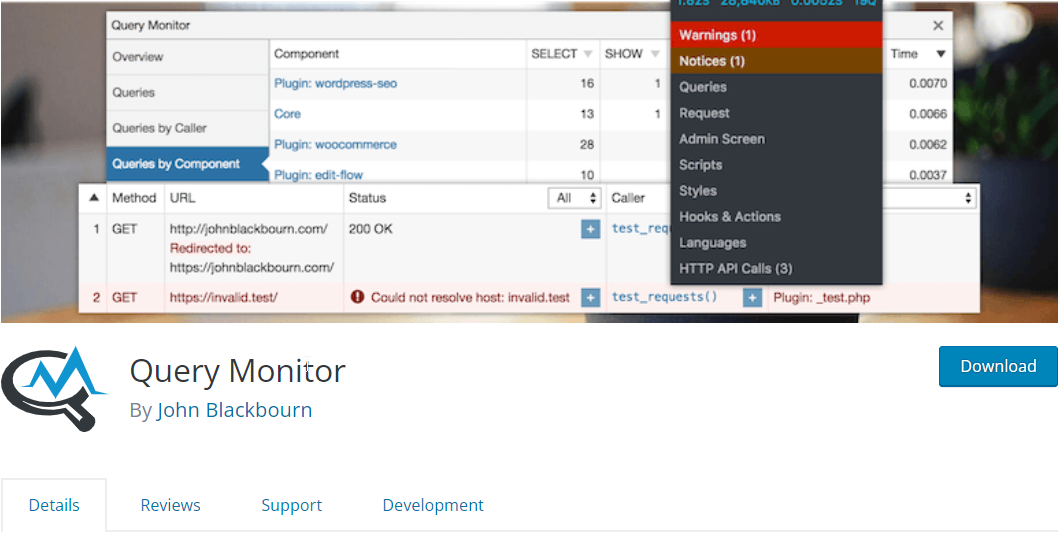
It also incorporates some advanced features like debugging of Ajax calls, REST API calls, and user capability checks. The remarkable feature of the plugin is its ability to narrow down its output by plugins and themes, letting you decipher the low-grade plugins and themes.
Query Monitor is also known for displaying handy information. You can add admin toolbar menu to show current page overview with debugging information displayed in panels once you select a menu item.
Debug Bar:
Debug Bar is a highly trusted debugging WordPress tool that you can leverage from WP admin. It lets you get quick access to different types of debugging information like cache, query, and so on. The tool appears on top of the admin bar of the site easing you to debug information from both front-end and back-end.
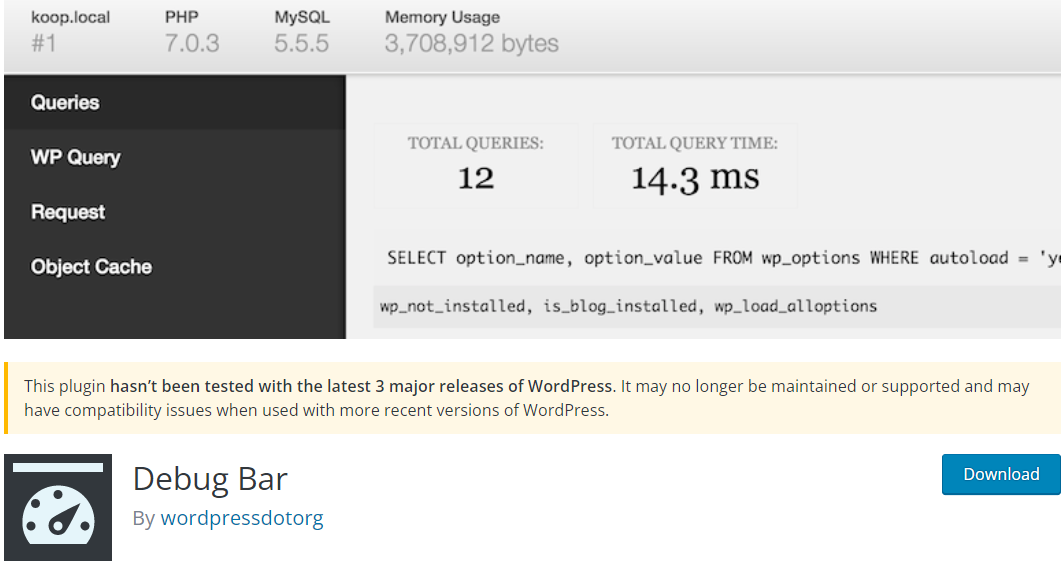
In the Debug Bar plugin, you will have several options to identify issues in your code. For example, you can enable tracking of PHP warnings and notices by having WP_DEBUG activated. Additionally, to figure out performance issues of your site, you can enable SAVEQUERIES which exposes and tracks MYSQL.
Activate WP_DEBUG:
The simplest way to log any problem in WordPress is activating WP_DEBUG which you can do by editing wp-config.php file. WP_DEBUG is the built-in default debugging mode in WordPress and it has 2 subtypes.
One is WP_DEBUG_DISPLAY which shows errors on screen and the other one is WP_DEBUG_LOG which saves the error messages in wp-content/debug.log.
To activate WP_DEBUG, you can navigate to the root directory of your website. You can perform this either through your hosting provider’s File Manager or by using a File Transfer Protocol (FTP) client like FileZilla. The wp-config.php file will be located under public_html folder.
After you find and open the file, the next step is to copy and paste the following code snippet:
// Enable WP_DEBUG mode
define( 'WP_DEBUG', true );
// Enable Debug logging to the /wp-content/debug.log file
define( 'WP_DEBUG_LOG', true );
// Disable display of errors and warnings
define( 'WP_DEBUG_DISPLAY', false );
@ini_set( 'display_errors', 0 );
// Use dev versions of core JS and CSS files (only needed if you are modifying these core files)
define( 'SCRIPT_DEBUG', true );
Point to be noted is that this should be inserted prior to the line that reads “/* That’s all, stop editing! Happy blogging. */”. Once you’re done, be sure to save your changes.
Enable WPDB Error Reporting:
If you work with the WPDB class to deal with your database, it’s very crucial to do the WPDB error reporting. With this error reporting, you can make sure if your queries are running perfectly or not. On top of that, it will also show the error messages for debugging WordPress.
There is a variable called $show_errors in the $wpdb object. If you set this to true, you can prompt WordPress to output the SQL errors to the screen for any given query.
global $wpdb;
// Before running your query:
$wpdb->show_errors = TRUE;
$result = $wpdb->get_results("SELECT field_value FROM table_name");
if(! $result){
    $wpdb->print_error();
    // Or you can choose to show the last tried query.
    echo $wpdb->last_query;
}
In order to enable this, go to your /public_html/wp-includes/wp-db.php and open the file. Search for the wpdb class and alter the $show_errors variable to true.
Deploy WordPress Staging Site:
Not familiar with the term “staging site”? Well, a staging site is an exact clone of your live site. You can host a staging site in your private subdomain without public visibility. That’s why a staging site is a perfect place to execute your code at first.
A staging site acts as a development ground allowing you to implement whatever codes you wish to push in your live site. As staging environment is invisible to people and search engine, it’s an ideal platform to test, tweak, and fine-tune your codes before moving them on to the live site.
Identify PHP Errors:
In PHP, you can retain a log of errors as it comes with its own level of error reporting. With a phpinfo file, you can easily detect PHP errors early in your scripts. This phpinfo file is able to output information about the PHP current state.
The types of information include the compilation options and extensions, version, environment, OS version, HTTP headers, and license. In order to do so, you can configure the php.ini file to enable the PHP error reporting and specify a location to store the error log.
error_reporting = E_ALL | E_STRICT
error_log = /var/log/php_error.log
However, you may find this option disabled in some of the hosting plans like Hostinger’s shared hosting plan. In that case, you can deploy the PHP code checker which will provide you with an assistant to review botches in your code. The tool will enable you to find and fix the syntax errors like a misspelled function or a missing semicolon.
But if your syntax has no errors, you have to come up with IDEs like Eclipse and PHPStorm. These tools will break the codes and let you check whether you are doing anything logically wrong like overlooking a variable that you stored earlier in a string.
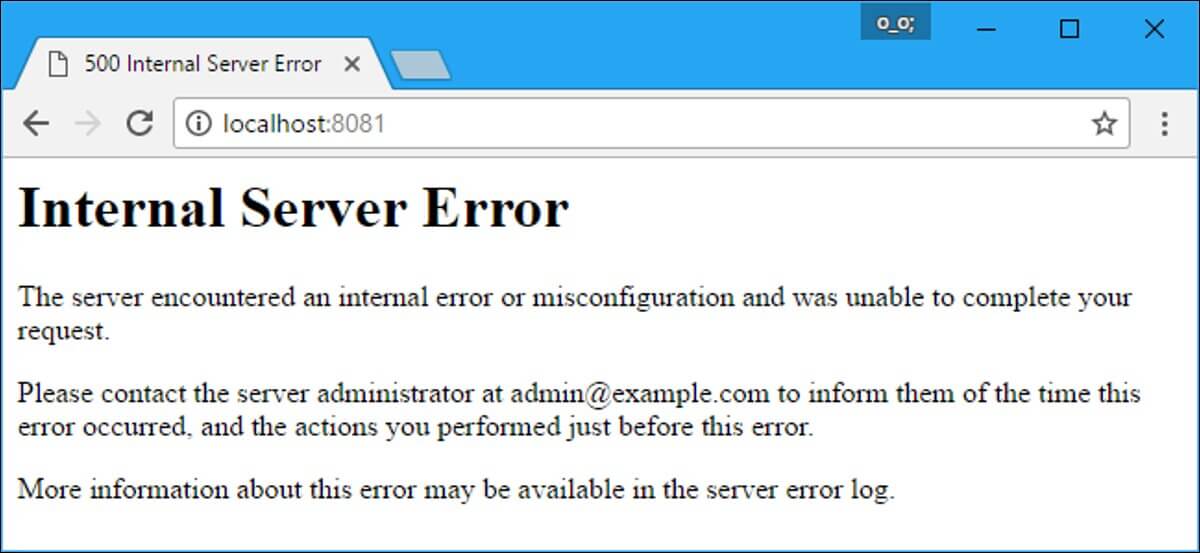
Examine your Website’s Server Error Logs:
One of the common website errors that you can encounter is the “Internal Server Error” while browsing your site. This type of error can be due to the script exceeding the maximum runtime. Neither PHP nor WordPress can detect such types of coding errors. Hence, you won’t get any PHP error message for such errors.
This is where visiting and reviewing your website’s error logs come into play. A general log check-up can assist both newbies and advanced developers to figure out the issues. You can fathom from the error log if the error is from PHP code or due to any slip-up in the WordPress installation.
You can also ring up your hosting service provider to know the location of your error logs. They can also let you know about any possible reasons that might have caused the internal server errors.
Enable SCRIPT_DEBUG:
To minimize the loading time and bandwidth usage, WordPress, by default, uses the minified versions of CSS and JavaScript files. The use of minified versions may hide errors in scripts or plugins that you leverage. To get rid of this issue, WordPress also provides with a constant that you can add to the wp-config.php file, that is-
define( ‘SCRIPT_DEBUG’, true );
If the constant “SCRIPT_DEBUG” is defined as “true”, WordPress will automatically load the non-minified versions of both CSS and JavaScript files, making all the plugins use their full versions.
Over to you:
Debugging WordPress isn’t a walk in a park, rather it’s an uphill task and gets tedious at times. But if you follow the 7 tips that we cataloged in this post, you are likely to find the process simpler and easier.
As a matter of fact, we always have a tendency to rely on backup data instead of discovering and fixing existing issues. This isn’t advisable whatsoever as without fixing the existing issues, you will encounter the same issues or bugs again with your backups.
Therefore, work hard and identify WordPress site bugs, follow the above hacks and debug your WordPress site. With that, you will get the hang of coding and also be able to debug your WordPress site. Once the bugs are fixed, you are likely to get better fruit from your WordPress site as well.
However, if you are hunting for an Elementor addon to build your WordPress site, you can rely on ElementsKit, an all-in-one addon for Elementor.

Leave a Reply