


PopupKit’s Analytics Dashboard helps you track popup campaign performance with essential data at your fingertips. You can get to know how your campaign performs based on device and locations.
And, you can easily see the current conversion rate and other essential metrics to do A/B testing of your popup campaign.
Here’s how to use each feature of PopupKit analytics dashboard:
How to Configure PopupKit Analytics Dashboard? #
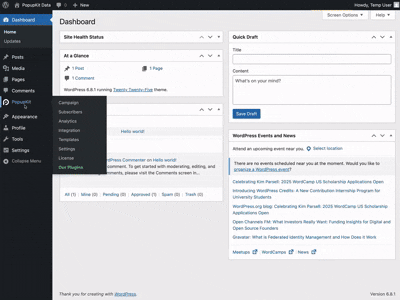
Start from your WordPress dashboard and navigate to PopupKit > Analytics. You’ll land on a dashboard with analytical panels providing different information on your popup campaigns. You can customize this dashboard depending on dates and campaign.
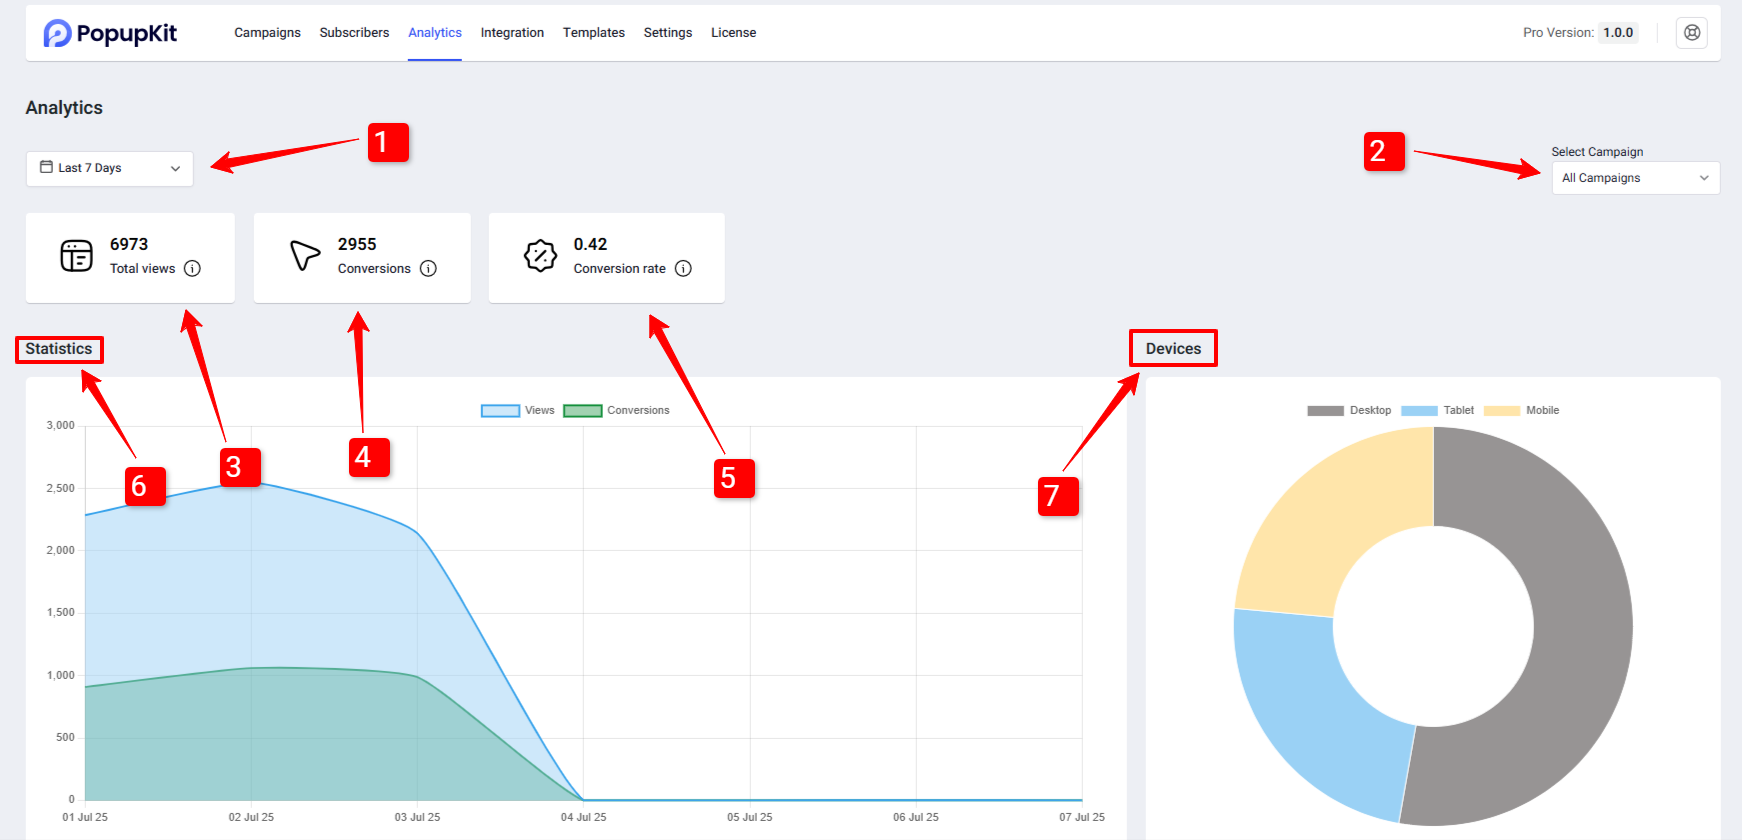
- Date: Choose a specific date range to analyze your popup campaign performance. You can select preset ranges like Today, Last 7 Days, Last 30 Days, or define a custom range using the calendar view. This lets you monitor campaign results for any specific period.
- Select Campaign: Use this dropdown to filter analytics by campaign type. If you’re running multiple popups across different campaigns, this option helps you view the performance of a specific campaign without distraction.
- Vues totales: Displays the total number of times your popup has been shown to visitors within the selected date range. It’s a quick indicator of your campaign’s reach and visibility.
- Conversions : Shows how many visitors took your desired action after seeing the popup, such as subscribing, signing up, or clicking a CTA. This helps you measure how effective your popup is at converting visitors.
- Conversion Rate: Find out what percentage of visitors converted into subscribers.
- Statistics View: Get a detailed graphical overview of your campaign’s performance trends. This includes visual charts and graphs that make it easier to interpret data like views, conversions, and conversion rates over time.
- Dispositifs: See which devices your visitors were using—such as desktop, tablet, or mobile. This helps you understand where your popups are performing best and whether you need to optimize for specific devices.
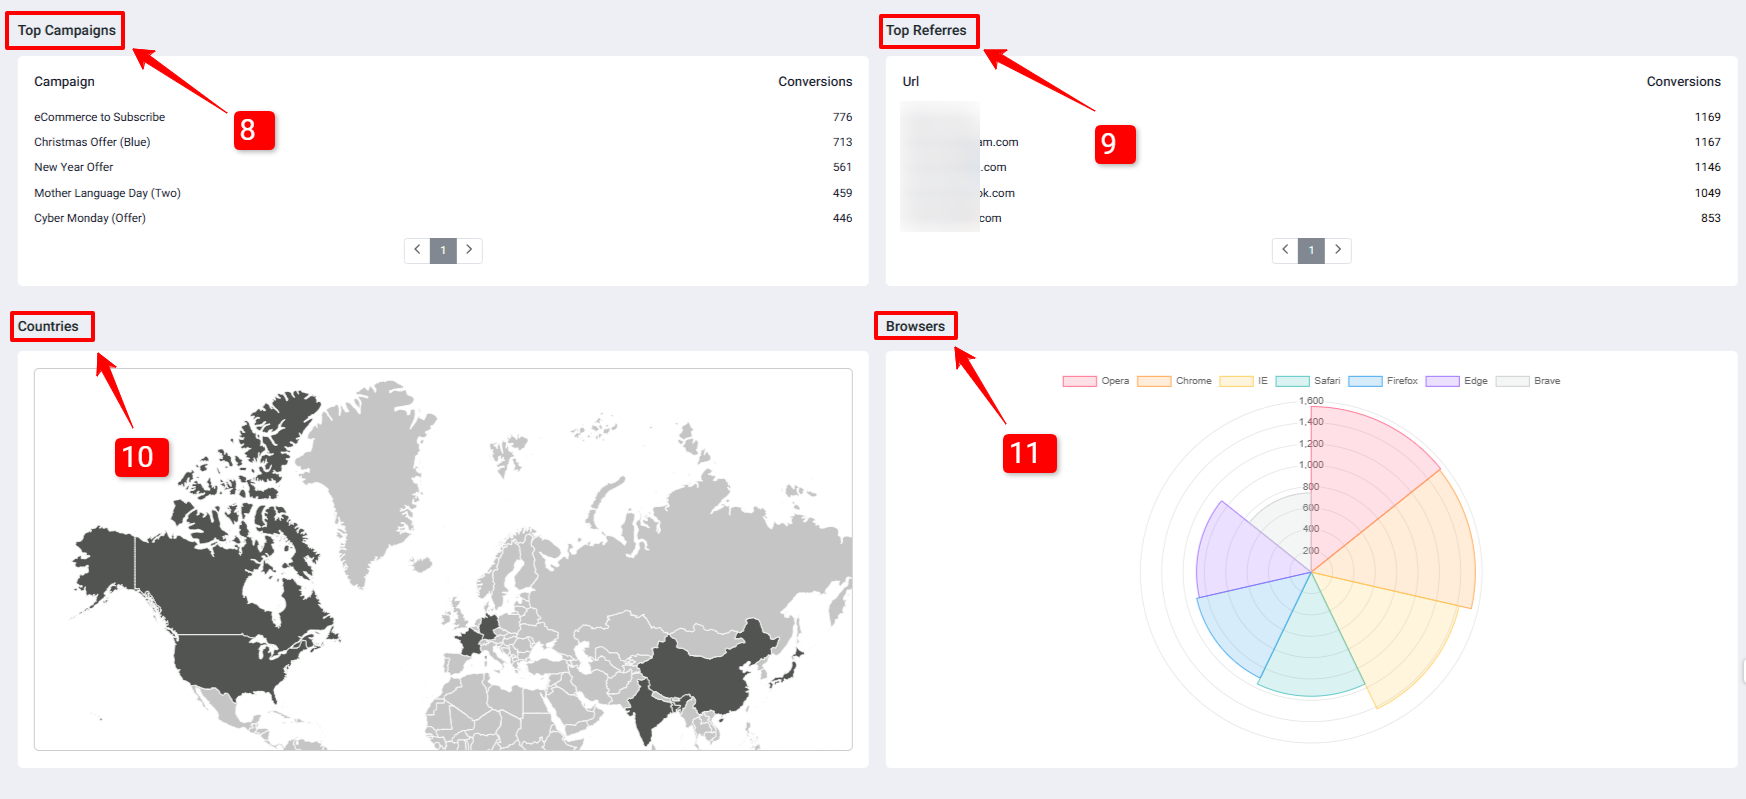
- Top Campaigns: Lists your highest-performing popup campaigns based on views and conversions. This lets you quickly identify which campaigns are driving the best results.
- Top References: Find out where your traffic is coming from. This section shows the websites, social platforms, or sources that referred visitors to your site who interacted with your popups.
- Countries: Easily locate where your visitors are seeing this campaign. An intuitive map view easily indicates where the most subscribers are coming from. When you hover over the map, it separates different countries and tells you how many views you get from that particular country. This is a smart panel to get quick ideas and take action.
- Browsers: Understand which browsers your visitors are using, like Chrome, Firefox, Safari, etc. This ensures your popups are optimized and functioning properly across all popular browsers.
Analyzing all these data and insights, you can easily figure out how to optimize the current campaing and what measures to take for the next campaign.